
Page 12 - PARMALAT 2017 ANNUAL REPORT
P. 12
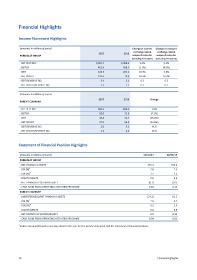
Financial Highlights


            Income Statement Highlights

             (amounts in millions of euros)                                      Change at current   Change at constant
                                                                                  exchange rate &   exchange rate &
                                                             2017           2016
             PARMALAT GROUP                                                      scope of consolid.   scope of consolid.
                                                                                 (including Venezuela)   (excluding Venezuela)
             - NET REVENUE                                 6,695.5        6,489.4    3.2%           0.1%
             - EBITDA                                       453.6          458.5     (1.1%)        (4.5%)
             - EBIT                                         226.3          205.2     10.3%          5.4%
             - NET PROFIT                                   103.6           79.4     30.5%         26.9%
             - EBIT/REVENUE (%)                               3.4            3.1      0.3           0.2
             - NET PROFIT/REVENUE (%)                         1.5            1.2      0.3           0.3

             (amounts in millions of euros)
                                                             2017           2016            Change
             PARENT COMPANY
             - NET REVENUE                                  888.9          846.4             5.0%
             - EBITDA                                        68.0           71.0            (4.2%)
             - EBIT                                          18.8           54.7            (65.6%)
             - NET PROFIT                                    27.0           56.9            (52.5%)
             - EBIT/REVENUE (%)                               2.0            6.2             (4.2)
             - NET PROFIT/REVENUE (%)                         2.9            6.4             (3.5)


            Statement of Financial Position Highlights

             (amounts in millions of euros)                                             12/31/17      12/31/16
             PARMALAT GROUP
             - NET FINANCIAL ASSETS                                                       255.3         334.4
                   1
             - ROI (%)                                                                      7.8           7.3
                   1
             - ROE (%)                                                                      3.2           2.5
             - EQUITY/ASSETS                                                                0.6           0.6
             - NET FINANCIAL POSITION/EQUITY                                               (0.1)         (0.1)
             - CASH FLOW FROM OPERATING ACTIVITIES PER SHARE                               0.18          0.19
             PARENT COMPANY
             - (INDEBTEDNESS)/NET FINANCIAL ASSETS                                        (24.2)         61.3
                   1
             - ROI (%)                                                                      2.0           6.7
                   1
             - ROE (%)                                                                      0.9           1.9
             - EQUITY/ASSETS                                                                0.8           0.8
             - NET FINANCIAL POSITION/EQUITY                                                0.0          (0.0)
             - CASH FLOW FROM OPERATING ACTIVITIES PER SHARE                               0.04          0.02

            1
             Indices computed based on average data for the year for the income statement and the statement of financial position.


            10                                                                                  Financial Highlights